Markets in perspective

Crisis and events
S&P 500 Index since 1970
This chart shows the growth of $10,000 based on S&P 500 Index performance over the last several decades. We believe looking at the market’s overall resiliency through major crises and events helps to gain a fresh perspective on the benefits of investing for the long-term.
The average annual total return of the S&P 500 index for the period shown below was 10.90%.
Past performance is no guarantee of future results.

Staying the course
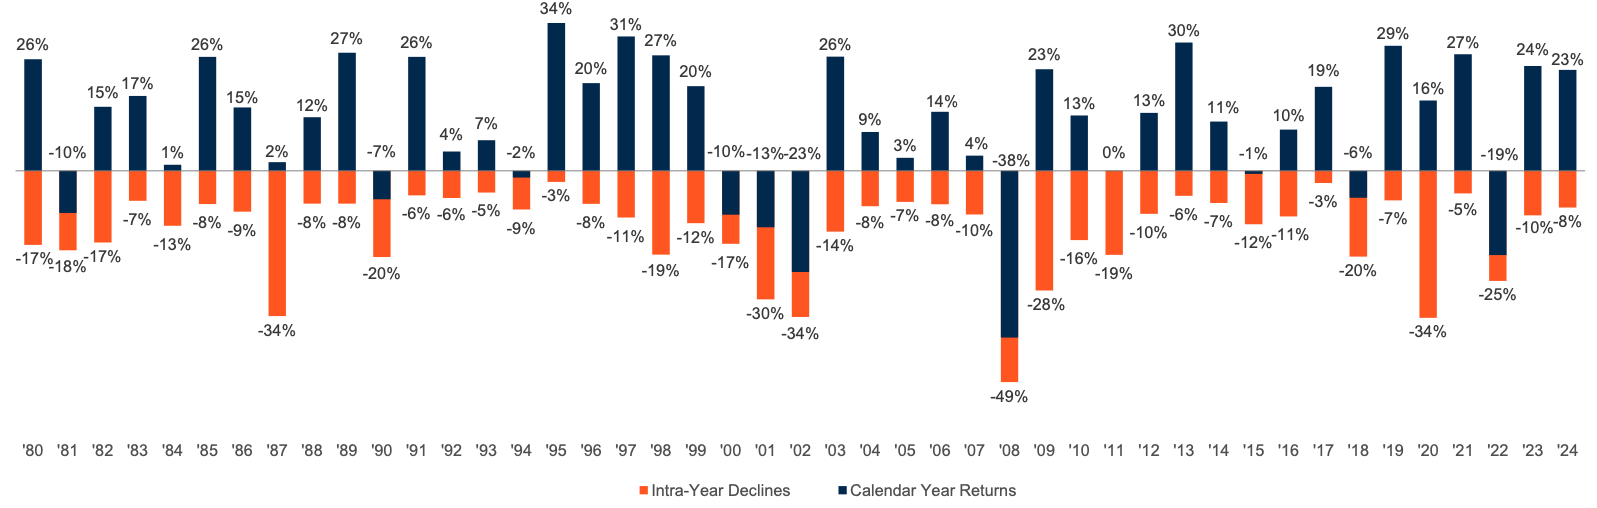
Volatility is not a recent phenomenon. Each year, there is the potential for the market to experience a significant correction, which for the S&P 500 has averaged approximately 14% since 1980. History has shown that those who chose to stay the course were rewarded for their patience more often than not.
Intra-year declines vs. Calendar year returns
Past performance is no guarantee of future results.
Stocks won!
This chart shows the cumulative return of different asset classes following the S&P 500 Index market peak before the Financial Panic of 2008. We believe a comparison of asset class performance through the financial panic and subsequent recovery helps to show the benefits of investing for the long-term.
Cumulative return (%) Sep ‘07 = 0 (annualized returns in parenthesis) Past performance is no guarantee of future results.

History of U.S. bear & bull markets
Daily returns since 1942
This chart shows daily historical performance of the S&P 500 Index throughout the U.S. Bull and Bear Markets since 1942. We believe looking at the history of the market’s expansions and recessions helps to gain a fresh perspective on the benefits of investing for the long-term.
- The average Bull Market period lasted 4.3 years with an average cumulative total return of 149.8%.
- The average Bear Market period lasted 11.1 months with an average cumulative loss of -31.7%.
Past performance is no guarantee of future results.


Missing the best days in the market
Investing in the stock market can be volatile, which may tempt some investors to pull out of the market to avoid the bad days. However, it is impossible to predict when good and bad days will happen. This chart shows the potential effect that pulling out of the stock market could have on a portfolio. An investor does not have to miss many good days to feel the financial impact over time. We believe investors will be rewarded for sticking with their investment plan.
Growth of $10k Invested in the S&P 500 Index: 31/12/79 – 31/12/24
Past performance is no guarantee of future results.

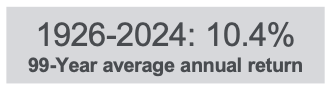
S&P 500 Index: positive and negative years since 1926
Below we look at the S&P 500 Index since 1926 and compare the average annual total returns of the last 98 years. Although stock market returns fluctuate significantly, since 1926, the S&P 500 Index produced positive returns 73% of the time, with an average of 21.4%. In 27% of those years the return was negative, with an average of -13.4%.
Past performance is no guarantee of future results.

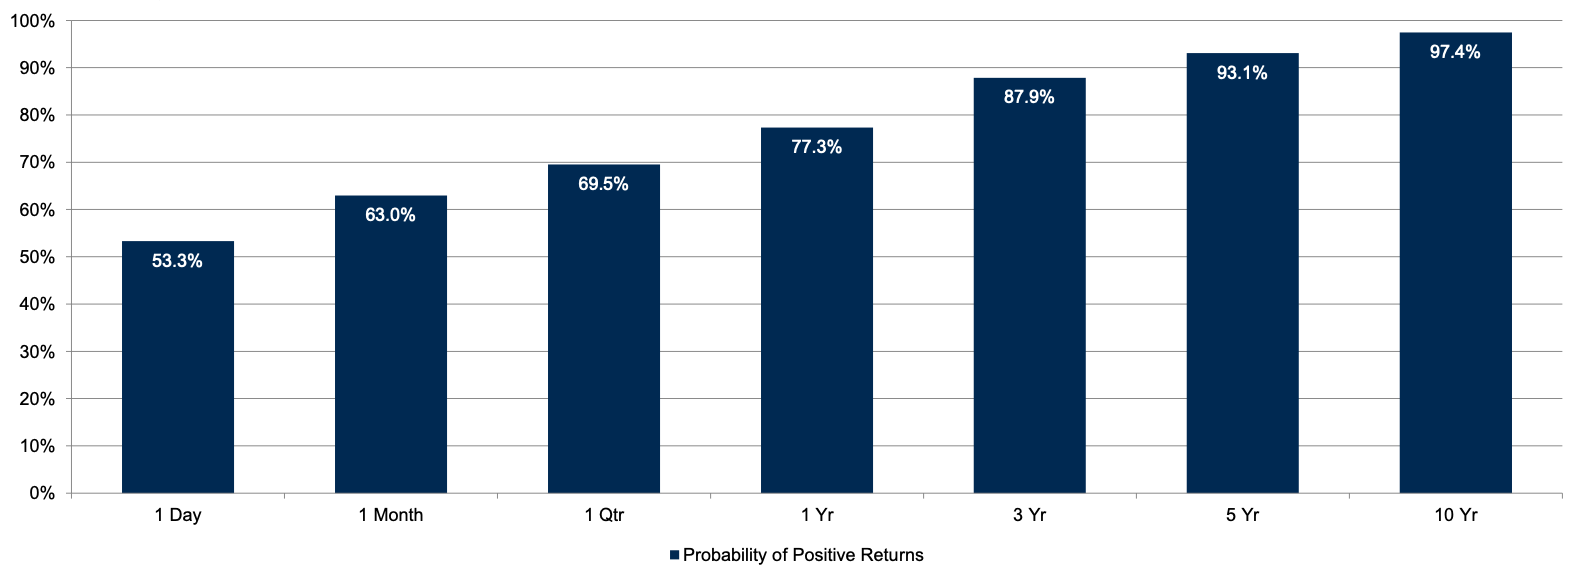
Probability of positive returns
S&P 500 Index since 1937
Investing in the stock market can be volatile. For this reason, we believe it is important to keep proper perspective when stocks rise or fall over short periods of time. History has shown that the odds of achieving a positive return are dramatically increased the longer the investment horizon.
Past performance is no guarantee of future results.
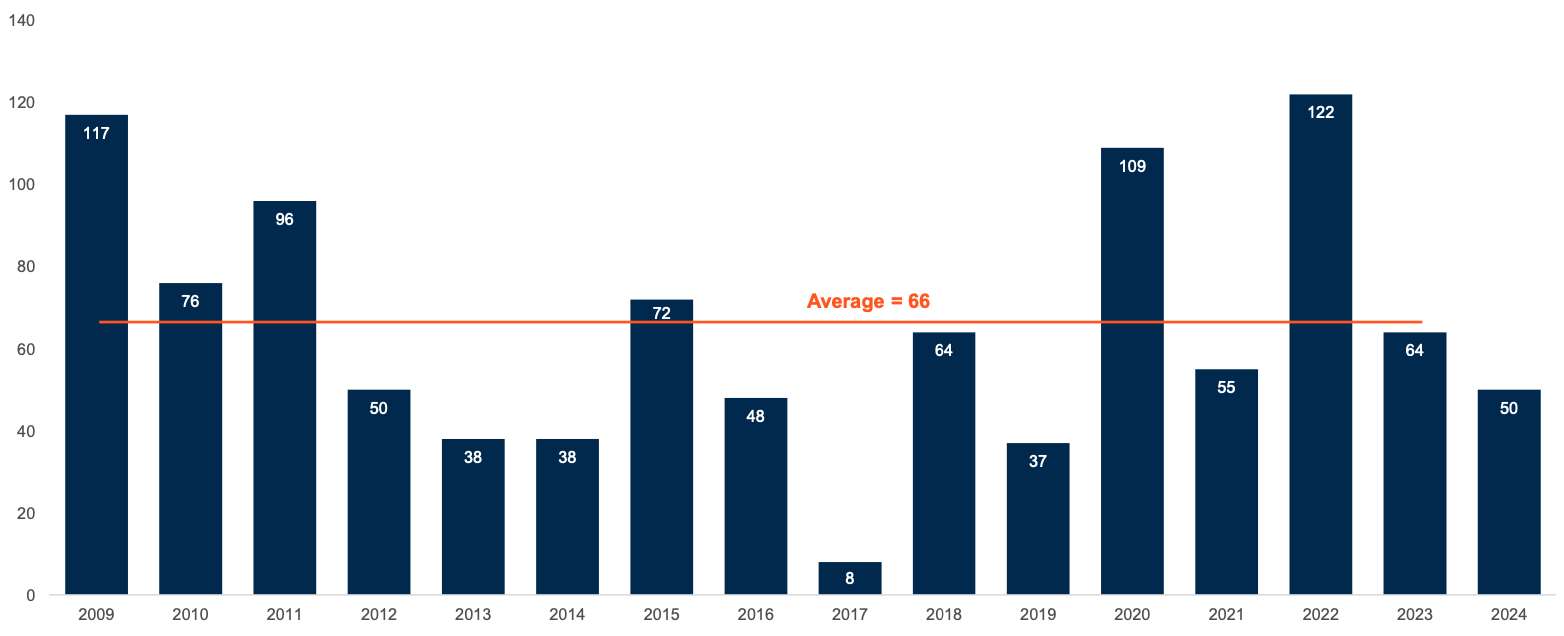
S&P 500 daily volatility
# of days with >1% moves
Past performance is no guarantee of future results.
S&P 500 Index: Performance
After its worst days
The chart and table below list the 15 largest single day percentage losses in the S&P 500 Index since 1960 and the subsequent price performance of the index for the 1-, 3-, 5-, and 10-year periods that followed. Looking back, the S&P 500 Index produced positive price appreciation, on average, in each of the periods. While stocks have sometimes experienced extreme volatility over short periods of time, we believe investors who remain committed to their long-term investment plan will continue to be rewarded over longer periods.
S&P 500 index performance during and after extreme down days
Past performance is no guarantee of future results.


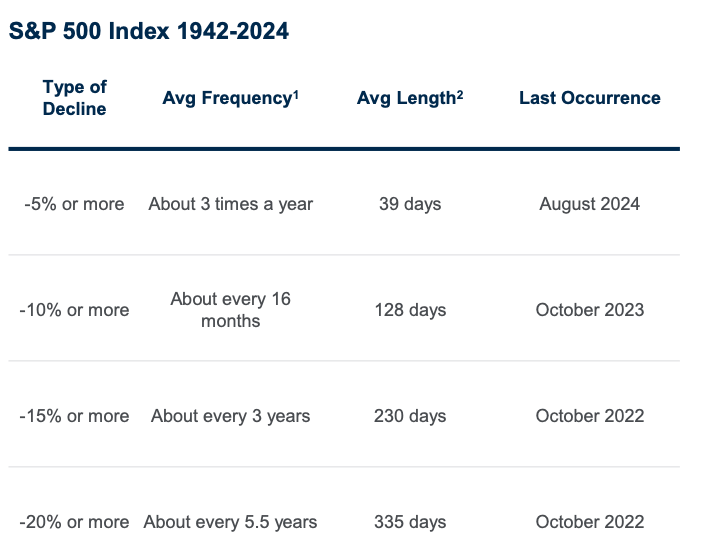
A history of market corrections
Investors like to avoid stock market declines at all costs, but declines are an inevitable part of investing. A little historical background can help put stock market declines in perspective.
Past performance is no guarantee of future results.